MarketFlow
MarketFlow (mflow) is AlphaPy Pro’s specialized pipeline for financial market
analysis and algorithmic trading. It transforms raw market data into machine learning
models for market predictions, portfolio optimization, and systematic trading strategies.
Overview
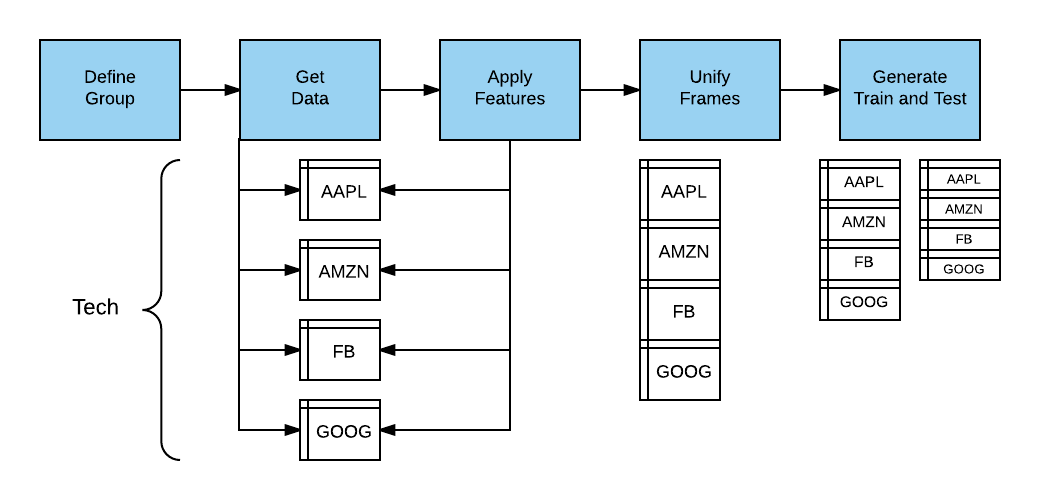
MarketFlow provides a complete workflow for quantitative finance:
Data Acquisition - Fetch market data from multiple sources
Feature Engineering - Create technical indicators and market features
Signal Generation - Build predictive models for market movements
Portfolio Construction - Optimize position sizing and risk management
Backtesting - Evaluate strategy performance with realistic assumptions
Modern Data Sources
AlphaPy Pro MarketFlow supports multiple professional-grade data providers:
Primary Data Sources:
EODHD (End of Day Historical Data) - Daily and intraday market data
Yahoo Finance - Free daily stock data via yfinance
Polygon - Professional real-time and historical market data
Legacy Support:
Google Finance - Deprecated (API discontinued in 2017)
Quandl - Limited free tier available
Note
Google Finance intraday data is no longer available. Modern applications should use EODHD or Polygon for intraday data requirements.
Data Format and Structure
MarketFlow standardizes all market data into a consistent format:
Daily Market Data (OHLCV):
Date,Open,High,Low,Close,Volume,Symbol
2024-01-02,185.64,186.89,183.86,185.64,52844800,AAPL
2024-01-03,184.97,185.89,182.73,184.25,58414800,AAPL
Intraday Market Data:
Datetime,Open,High,Low,Close,Volume,Symbol,bar_number
2024-01-02 09:30:00,185.64,185.89,185.30,185.50,125400,AAPL,1
2024-01-02 09:31:00,185.50,185.75,185.25,185.60,98300,AAPL,2
Configuration
MarketFlow uses a hierarchical configuration system combining multiple YAML files:
market.yml - Market-specific configuration:
market:
    data_history      : 252              # Trading days of history
    forecast_period   : 1                # Days to forecast
    fractal          : '1d'              # Time frame (1d, 1h, 5m)
    leaders          : ['open']          # Features available at market open
    predict_history  : 100               # Min periods for prediction
    schema           : 'prices'          # Data schema identifier
    target_group     : 'tech'            # Symbol group to analyze

groups:
    tech:
        - AAPL
        - MSFT
        - GOOGL
        - META
        - TSLA

    crypto:
        - BTC-USD
        - ETH-USD
        - ADA-USD

    etf:
        - SPY
        - QQQ
        - IWM
Data Source Configuration:
data_sources:
    primary: 'eodhd'                    # Primary data source
    fallback: 'yahoo'                   # Fallback source

    eodhd:
        api_key: 'your_api_key'
        base_url: 'https://eodhistoricaldata.com/api/'

    polygon:
        api_key: 'your_polygon_key'
        base_url: 'https://api.polygon.io/'
Variable Definition Language (VDL)
MarketFlow includes a powerful Variable Definition Language for creating technical indicators and custom features:
Basic Technical Indicators:
variables:
    # Moving averages
    sma_20: 'mean(close, 20)'           # Simple moving average
    ema_12: 'ewm(close, 12)'            # Exponential moving average

    # Momentum indicators
    rsi_14: 'rsi(close, 14)'            # Relative Strength Index
    macd: 'macd(close, 12, 26, 9)'      # MACD

    # Volatility indicators
    bb_upper: 'bollinger_upper(close, 20, 2)'  # Bollinger Bands
    atr_14: 'atr(high, low, close, 14)'        # Average True Range

    # Volume indicators
    obv: 'on_balance_volume(close, volume)'     # On Balance Volume
    vwap: 'volume_weighted_average_price(high, low, close, volume)'
Custom Expressions:
variables:
    # Price relationships
    above_sma: 'close > sma_20'         # Boolean: price above SMA
    price_momentum: 'close / sma_50'    # Price relative to trend

    # Volatility measures
    daily_return: 'pct_change(close, 1)'
    volatility: 'std(daily_return, 20)'

    # Multi-timeframe
    weekly_high: 'resample(high, "W", "max")'
Aliases for Convenience:
aliases:
    cma: 'sma_close'                    # Closing moving average
    vol: 'volume'                       # Volume shorthand
    ret: 'pct_change(close, 1)'         # Daily returns
Advanced Features
Meta-Labeling:
MarketFlow implements the Triple Barrier Method for advanced financial ML:
model:
    meta_labeling:
        option: True
        profit_target: 0.02             # 2% profit target
        stop_loss: 0.01                 # 1% stop loss
        max_holding: 5                  # Max holding period (days)
        volatility_window: 20           # Volatility calculation window
Time Series Cross-Validation:
Proper time series validation that respects temporal order:
model:
    time_series:
        option: True
        cv_method: 'time_series_split'   # Time-aware CV
        test_size: 0.2                   # Recent 20% for testing
        gap: 1                           # Gap between train/test
Portfolio Optimization:
portfolio:
    optimization: 'mean_variance'        # Optimization method
    max_weight: 0.1                     # Max position size
    rebalance_freq: 'monthly'           # Rebalancing frequency
    transaction_cost: 0.001             # 10 bps transaction cost
Running MarketFlow
Basic Usage:
# Train models for default group
mflow

# Train with specific date range
mflow --tdate 2020-01-01 --pdate 2023-12-31

# Generate predictions only
mflow --predict
Configuration Options:
# Use different data source
mflow --source eodhd

# Extended history
mflow --history 500

# Different time frame
mflow --fractal 1h
Output Structure
MarketFlow generates comprehensive output for analysis:
runs/run_YYYYMMDD_HHMMSS/
├── config/
│   ├── market.yml
│   └── model.yml
├── data/
│   ├── features/              # Engineered features
│   ├── prices/                # Raw price data
│   └── indicators/            # Technical indicators
├── models/
│   ├── signal_model.pkl       # Trained prediction model
│   └── portfolio_model.pkl    # Portfolio optimization
├── predictions/
│   ├── signals.csv            # Model predictions
│   └── positions.csv          # Portfolio positions
└── analysis/
    ├── backtest_results.html  # Performance report
    ├── factor_analysis.csv    # Factor attribution
    └── risk_metrics.csv       # Risk analytics
Trading Systems Integration
MarketFlow can generate trading signals for various execution platforms:
Signal Generation:
systems:
    long_short:
        signal_long: 'prediction > 0.6'     # Long threshold
        signal_short: 'prediction < 0.4'    # Short threshold
        max_positions: 20                   # Position limit

    momentum:
        signal_long: 'close > sma_20 and rsi_14 < 70'
        signal_exit: 'close < sma_20 or rsi_14 > 80'
Risk Management:
risk:
    max_portfolio_vol: 0.15             # 15% max portfolio volatility
    max_individual_weight: 0.05         # 5% max individual position
    stop_loss: 0.02                     # 2% stop loss
    profit_target: 0.04                 # 4% profit target
Example Applications
1. Momentum Strategy:
target: 'future_return_5d > 0.02'       # 2% return in 5 days
features:
    - 'rsi_14'
    - 'macd_signal'
    - 'volume_ratio_20'
    - 'price_momentum_50'
2. Mean Reversion:
target: 'future_return_1d'
features:
    - 'zscore_close_20'                  # Z-score of price
    - 'rsi_oversold'                     # RSI < 30
    - 'bollinger_position'              # Position in Bollinger Bands
3. Multi-Asset Strategy:
groups:
    universe:
        - SPY    # S&P 500
        - TLT    # 20+ Year Treasury
        - GLD    # Gold
        - VIX    # Volatility

features:
    - 'correlation_spy_20'
    - 'relative_strength'
    - 'regime_indicator'
Performance Analytics
MarketFlow provides comprehensive performance analysis:
Returns Analysis: * Total return and CAGR * Sharpe ratio and Sortino ratio * Maximum drawdown * Win rate and profit factor
Risk Metrics: * Value at Risk (VaR) * Conditional VaR (CVaR) * Beta and correlation analysis * Factor exposure analysis
Trading Metrics: * Transaction costs * Turnover and capacity * Implementation shortfall * Market impact analysis
Best Practices
Data Quality - Validate data sources and handle corporate actions
Feature Engineering - Focus on regime-aware features
Walk-Forward Analysis - Use time-series cross-validation
Risk Management - Implement proper position sizing
Transaction Costs - Account for realistic trading costs
Out-of-Sample Testing - Reserve recent data for final validation
For detailed examples, see the projects/ directory which includes:
Shannon’s Demon trading strategy
Time series momentum models
Triple barrier method implementations